Post-modeling
In the post-modeling part, you will learn how to predict, evaluate, and correct species distribution models.
In modeling section, we have fitted three categories of models – Ensemble of Small Models (ESM), Standards models and Ensemble models.
Prediction
When you fit ESM with more than one algorithm, the prediction, will be done manually selecting the algorithm relevant to the model on which the prediction will be applied. The principle is the same for multiple standards models if one model is selected. If the number of modes selected is more than one, the selected models will be considered as a list and the prediction will be done for each model. Look out how to process the prediction for output of each category of model fitting.
- ESM

⚠ 1 . Make prediction for a list of small models is not supported. So select a unique model to predict.
⚠ 2. The prediction require predictors (raster layers) that must be provided in Predictor submenu of Pre-modeling menu
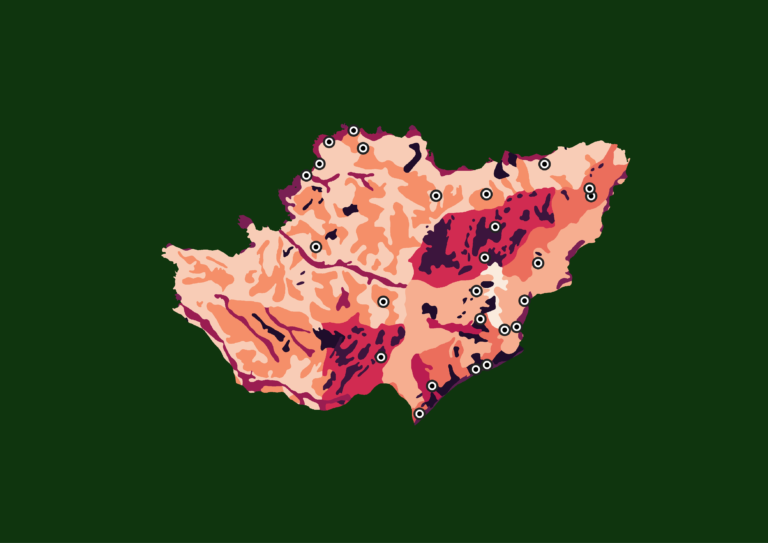
After selected a model, you provide threshold (optional) to use. Provide the desired and type of response, and then click on predict button. In the modal that appears, click on reload to charge the prediction. Once finished, the raster layer representing prediction output appears in the Prediction field. You can choose a layer (if there are more than one) and plot it dynamically. The Save button a right side of Load button allows to download the prediction in *.tiff format.


- Standard Models
In case multiple standard models are fitted, they are listed in a table in the Prediction menu. You can select models for which the prediction will be performed. In Model category, Standard models is destined for predicting list of individual models.

Select the desired clamp and type of response. Click on the predict button. A modal will appear. Click on reload to start the prediction. This may take some time. When the prediction is done, a raster layer will appear in the Prediction field. If there are multiple layers, you can choose one to plot it dynamically. To download the prediction in *.tiff format, click on the Save button on the right side of the Load button.


- Ensemble Models
Our standard models assembled in Modeling section can be used for prediction. All you need to predict ensemble model is select Ensemble in Model category and then click Predict button. In appeared models, click Load button for predicting ensembles.

- Merge performance
This feature combines model performance tables for all input models (standard models, ESM and ensemble model)
Extrapolation
Extrapolation is the process of estimating or concluding something by assuming that existing trends will continue or a current method will remain applicable.
In the context of the species distribution modeling, extrapolation corresponds to the part of the projection area for which one environmental value at least falls outside the reference dataset (Guillaumot et al. 2020). In other words, it is the part of the projection area that is beyond conditions used for model calibration.
It is easy to perform extrapolation with nimo. Provide predictors or environmental variables. Apply collinearity reducing to reduce or keep all predictors. Make sure you provide a database with spatial coordinates of species presences and absences (or pseudo-absence) as output of environment data extracted. Then, precise the Number of cores to use for parallelization (set to 1 by default). The Aggregation factor is the number of cells in each direction (horizontal and vertical) to reduce raster resolution.

Overprediction correction
Overprediction correction allow correcting overprediction of species distribution models based on occurrences and suitability patterns with a posteriori methods, i.e. it works on the already fitted models (Mendes et al. 2020) to reduce overprediction.
To reduce overprediction, provide a database with spatial coordinates of species presences and absences (or pseudo-absence). Look out a sample here. You must perform previously a prediction that will be used as raster with continuous suitability predictions. The procedure calculates the minimum pairwise-distances between all occurrences and then selects the maximum distance, i.e., the value of the buffer will be the maximum distance from the minimum distance.
In the example below, we apply a correction of prediction done by standards models. The correction can be performed on any model category.

Reference
Guillaumot, Charlène, Camille Moreau, Bruno Danis, and Thomas Saucède. 2020. “Extrapolation in Species Distribution Modelling. Application to Southern Ocean Marine Species.” Progress in Oceanography 188: 102438. https://linkinghub.elsevier.com/retrieve/pii/S0079661120301774.
Mendes, Poliana, Santiago José Elías Velazco, André Felipe Alves de Andrade, and Paulo De Marco. 2020. “Dealing with Overprediction in Species Distribution Models: How Adding Distance Constraints Can Improve Model Accuracy.” Ecological Modelling 431: 109180. https://linkinghub.elsevier.com/retrieve/pii/S0304380020302519.